FileCloud Server is a powerful on-prem file sharing and data governance solution for enterprises and institutions around the world. One of FileCloud’s strengths is the ability to integrate with third-party applications to better serve an organization; these include Active Directory and LDAP, Windows file servers, Microsoft and Google productivity apps, even security tools for SAML SSO, antivirus, malware protection, and SIEM.
In this article, we will describe how NagiosCSP can be used to monitor a FileCloud Server environment.
What is NagiosCSP?
Nagios CSP (Core Services Platform) bundles Nagios Core, a set of official plugins, sample add-ons, and a limited Nagios XI instance for evaluation. It supports agent-based checks (NCPA, NRPE), SNMP, and custom plugin checks. Use CSP when you prefer an on-premises Nagios toolset with prepackaged components.
Configuration Requirements for FileCloud and NagiosCSP
For this step-by-step configuration guide, FileCloud Server and its components were installed in a single node (Windows 2019 Datacenter). The FileCloud Server node is following the FileCloud Requirements.
|
Server name |
IP |
Server Role |
|
FCserver.localdomain |
192.168.10.225 |
Web, DB, Solr |
We also have a NagiosCSP machine through the VMWare Workstation Pro 17:
|
Server name |
IP |
|
nagiosCSP |
192.168.10.210 |
We also have a NagiosCSP machine through the VMWare Workstation Pro 17:
Our documentation provides more information on how to install and configure FileCloud Server.
Configure NagiosCSP as a Virtual Machine
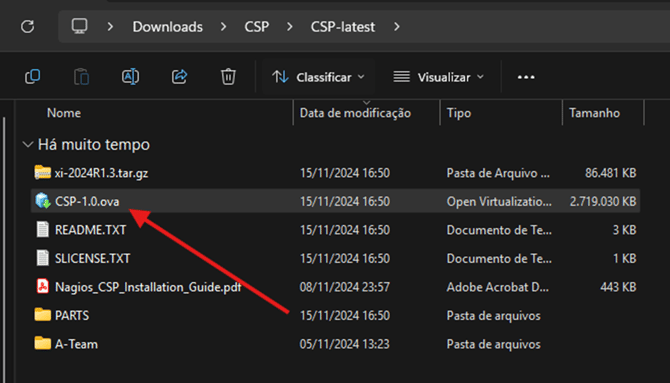
- Download the NagiosCSP.
- Install the NagiosCSP (there is a README.pdf file inside of the downloaded package with the installation steps)
- Double-click on the .OVA file. It will automatically open the VMware Workstation Pro 17:
- Type the virtual machine’s name and the path where its files will be stored. Click on the “Import” button:


- The VMware Workstation Pro 17 will automatically import it and create a new virtual machine:


- Click on “Power on this virtual machine”.

- Once the Operating System is loaded, you will see the login screen, the default user is root and the default password is nagiosxi:

- Once you are logged in, follow the bellow steps to specify a static IP address:
Specify a Static IP Address for NagiosCSP
Note: The .OVF virtual machine’s template uses DHCP to obtain the IP address by default. Follow the steps below to specify a static IP address:
- Log in as root user.
- List the network cards using the command ip address show, in this example we have the ens33:

- Set the static IP using the nmcli command:
Base syntax:
nmcli con mod ipv4.method manual ipv4.addresses / ipv4.gateway ipv4.dns " , "
Example:
Nmcli con mod ens33 ipv4.method manual ipv4.address 192.168.10.210/32 ipv4.gateway 192.168.10.1 ipv4.dns “192.168.10.1,8.8.8.8”
- Set the network card to automatically connect to the network once the virtual machine is started:
Base syntax:
nmcli con mod autoconnect yes
Example:
Nmcli con mod ens33 autoconnect yes
- These are the commands:
![]()
- Disable and enable the network card using the commands:
nmcli con down ens33
nmcli con up ens33
- Check if the network card is now using the new IP configuration using the command ip address show

- Now you can access the associated IP through the Web browser! Click on “Access Nagios XI”:

Update UI Settings for NagiosCSP
- Fill in the fields for Timezone, Language, User Interface Theme, and update the Trial license key. In this example, we use an HTTP protocol. Once you have entered this information, hit the “Next” button:

- On the next screen, change the password, Full name, and Email address (Note: The default user to log-in to the NagiosXI through the web browser is nagiosadmin). Then hit the “Finish install” button:

- The installation will be completed, and it will show the username and password. Hit the “Login to Nagios XI” button:


- Log in using the previous provided username and password:

- Review the “License Agreement”, hit the checkbox, and click on “Submit”:

You will see the Nagios XI interface and the main Dashboard page:

Configure NagiosCSP for FileCloud Server Machine Monitoring
Now we can configure the FileCloud Server’s machine monitoring.
- Install the Nagios XI agent (NCPA – Nagios Cross Platform Monitoring Agent).
- Install the Nagios XI NCPA on the FileCloud Server’s machine. Hit “Next”:

- Review the “License Agreement” and hit “I agree”:

- Type a token, then hit the “Next” button:
In our example, we use the token MonitoringFileCloudUsingNagiosXI) and the default listener parameters (0.0.0.0 as Bind IP means that all the network cards from my FileCloud Server’s machine will be available to communicate with my Nagios XI server).

- Now, add the Nagios XI Server’s IP on the “URL” field and type the token into the “NRDP Token” field. Hit “Next”:

- Confirm that “Install for anyone using this computer” option is checked and hit “Next”:

- By default, it will install to the C:\Program Files\Nagios\NCPA path. You can choose a different path if needed. Hit “Install”:

- Hit “Finish”:

Run the NagiosCSP Wizard to Set Up Monitoring
- Return to the Nagios XI web-browser interface and select “Run a Wizard”:

- Type “windows server” and select the “Windows Server” option from the search results:

- Type the FileCloud Server’s IP on the “Address” field, and type the token into the “Token” field:

- Configure threshold metrics for CPU Usage / User Count (filed under “System Metrics”), Memory Usage / Swap Usage (filed under “Memory Metrics”), “Disk Metrics”, and “Network Interface Metrics”.
In our example, we will use the default thresholds for “Disk Metrics” and “Network Interface Metrics”. These will need to be adjusted according to your SLAs (Service Level Agreements) and your own preferences:

- On the same screen, configure which services from the FileCloud Server machine will be monitored (use the CTRL key to select multiple services). The services below should be monitored:

- On the same screen, you may opt to monitor additional Windows Metrics, per the example below (we use the defaults and their thresholds). Hit “Next”:

- On the next screen, configure how the NCPA agent (FileCloud Server machine) will be monitored. To use the default values, hit “Finish with Defaults”:

- At this point, the FileCloud Server machine is already added into the Nagios XI Server’s configuration and it is already being monitored. Hit the “View status details for ”:

It will show the all the services/components that were added in previous steps and their status:

- Go to the Nagios XI Dashboard page (http://NagiosXI_Server_IP/nagiosxi/index.php). Here, it shows two hosts being monitored (the first is the Nagios XI server; the second is the FileCloud Server machine). Click on “Hosts” to display the monitored servers on a table:


Test the NagiosCSP Monitoring System
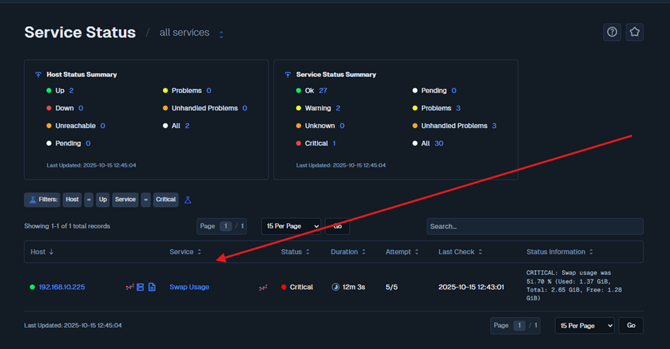
For our example, we stopped the “MongoDB” service in the FileCloud Control Panel:

After a few seconds, the FileCloud Server in the NagiosCSP dashboard shows the “MongoDB” service as Critical:
Let’s start the MongoDB service again through the FileCloud Control Panel. After a few seconds, the dashboard updates to remove the MongoDB critical status line.

It’s also possible to configure alerts (example: receive an alert via email when a node or service is not available). Follow the instructions from the Nagios XI documentation for “Notification Preferences” and “Notification Methods”.
Conclusion
FileCloud’s flexibility and extensibility make it a dynamic solution for enterprise IT environments that rely on different tools.